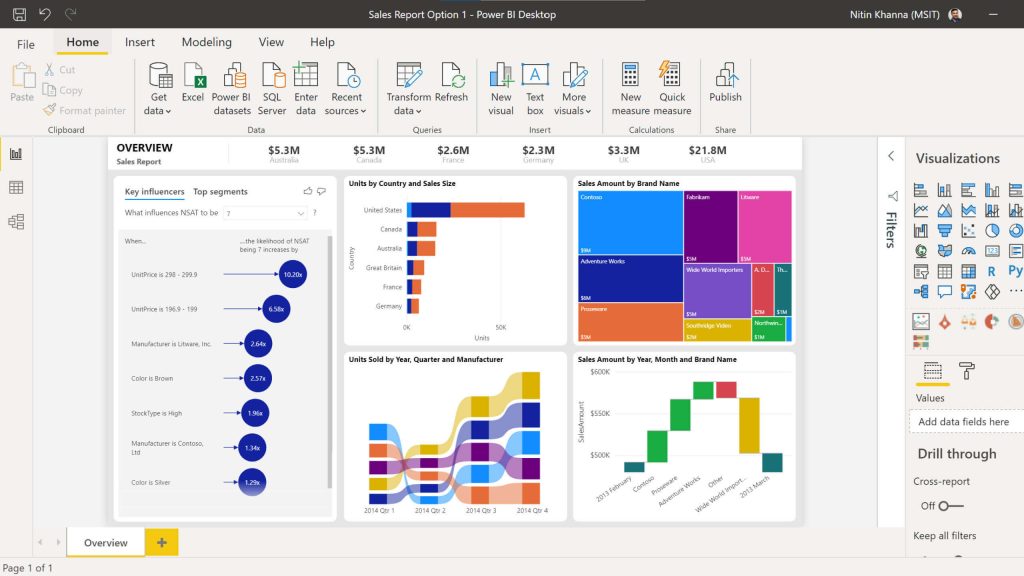
The business intelligence software Power BI has become an essential tool in the field of data analysis. As it becomes accessible to more and more small and medium-sized businesses, it is important to understand the differences between it and Excel’s tools, so you can distinguish the best time to use each, and thus bring your data analysis in line with your operations and strategies.
Power BI and Excel: Two Complementary Software Packages
Power BI and Excel are both data analysis tools developed by Microsoft. It is therefore not surprising that these two programs are designed to be complementary to each other. By using both pieces of software together, it is possible to collect, explore, visualize and analyze data sets more quickly and more accurately.
It is trivial to use workbooks created in Excel directly in Power BI. In fact, your Excel files can be used as a source of data that you can easily combine with your Power BI dashboards. In addition, you will benefit from Power BI’s advanced predictive capabilities and have access to richer, more innovative and interactive visualization models, for more accurate information.
The reverse is also true. Excel can use the work done in Power BI to create tables and charts. This means you can quickly perform less sophisticated analyses, while having only one source of data in your file.
In addition to all of this, Power BI and Excel share some common features, such as Power Pivot and Power Query. These features are fully integrated into Power BI, but are also available in the Windows version of Excel.
When Should You Use Power BI?
If you need to perform advanced data analysis, Power BI is your best bet, and if you want to create customized and fully dynamic dashboards, Power BI is a must.
By using this business intelligence tool, you will be able to connect many different data sources (such as your ERP, a SQL server, etc.), which is not possible with Excel. As a result, you will be able to cross-reference a lot of data, in order to obtain valuable insights that you would not otherwise have access to.
What’s more, with Power BI you can set up automatic updates for your data, which means your dashboards will be filled with up-to-date information, with no effort from you!
Power BI also makes it easier for you to collect data. You will in fact be able to automate many processes, saving you time – which you can then devote to the analysis of your data.
Another advantage Power BI has over Excel is that it was designed to facilitate information sharing within a company and team, and supports cross-departmental collaboration. Power BI can be accessed at any time and from many platforms, making it a must-have tool for hybrid work.
Finally, for more advanced users, it will be possible to perform data modeling and predictions using scripts coded in R, a powerful yet easy-to-learn programming language for data analysis!
To go further on Power BI, do not hesitate to consult our blog article or our webinar (French only) on the power of business intelligence at the service of your organization.
Source: Microsoft
When Should You Use Excel?
Excel remains an essential tool for data analysis. When you need to make a pivot table quickly, or want to visualize key performance indicators (KPI) in a few clicks, Excel is the ideal tool. In addition, the spreadsheet software from the Microsoft 365 suite is still unrivaled when it comes to performing complex calculations on a data set quickly.
In short…
Used together, Power BI and Excel are powerful and indispensable tools that will benefit the business intelligence in companies of all sizes. If you would like to discuss their possibilities with one of our experts, please contact us.


